Elements of the Template
The Trade Finder Templates are designed to allow you to ‘visually trade’.
When evaluating a position, a Bull Put for example, the template automatically sets up the trade. You can use the rolling icons to adjust the position: Roll the position up/down, roll out the time frame, adjust the strikes, etc. You can even adjust the Net Credit(Debit) of the trade in an attempt to get a more favorable entry cost/credit.
The Performance Channels show the profit/loss of the position.
The P/L summary at the bottom left of the screen shows the Risk/Reward ratio, Net/Total Credit (Debit),the break-even stock price point, the max reward/max risk with corresponding stock price.
A snapshot on the right side of the screen, provides a visual structure of the strategy, what market 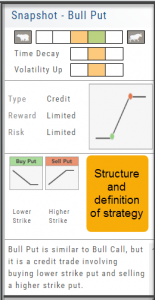 conditions are favorable to the trade, whether volatility and/or time positively, negatively or is neutralized by the strategy.
Greeks and Volatility are also shown.
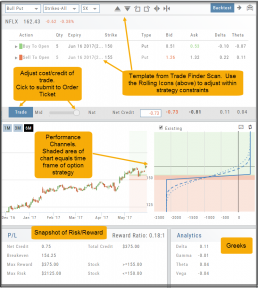
Once satisfied with the position set-up, click ‘Trade’ and the order will auto-fill in the “Order Ticket” of your brokerage account.
Important! While adjustments may to the template may be made, the system limits what can be changed in order to stay within the constraints of the strategy. This safety measure ensures you stay in the type of trade you intend to be in.
Historic & Implied Volatility
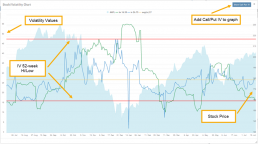
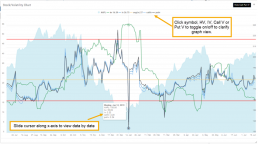
This chart displays Historic (HV) and Implied (IV) Volatility with the ability to overlay Call/Put IV
Historic Volatility (green line) is based on how the stock actually moved.
Implied Volatility (blue line) is based on how the options are priced.
When expanded, the stock chart, 12-Month Mean (Average) IV and one-year IV High/Low (red line) are also shown. This is very helpful in understanding if option premiums are comparable to historic values.
High HV indicates recent strong movement.
High IV indicates higher premium and, in many cases, anticipated movement.
Note: You can remove the Stock Chart, HV, IV or Call/Put IV simply by clicking on the corresponding indicator above the chart/graph.
How to use Backtesting
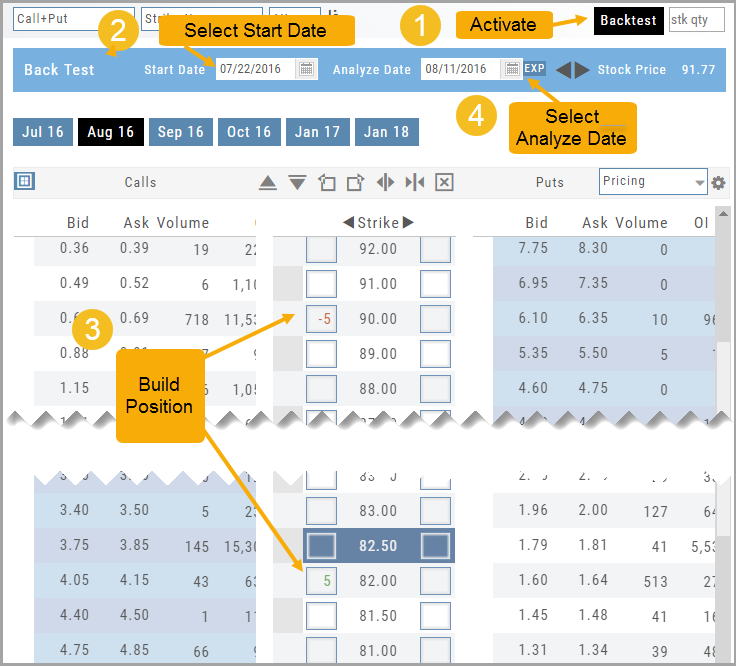
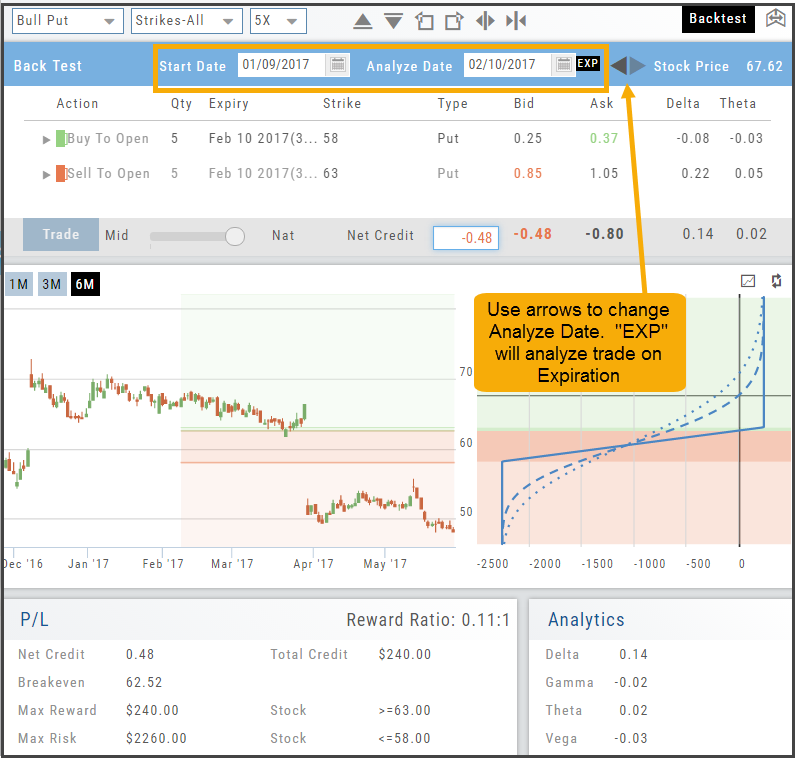
Activate by clicking “Backtest” in the upper right of the Option Table screen.
- Select a start date.
- Enter position in the options chain.
- Select analyze date.
Your position’s P/L Performance and Risk Chart are dynamically updated.
Entering a Position
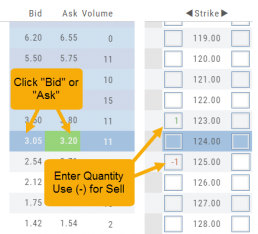
You can enter a position to analyze by clicking on ‘Ask’ for buying or ‘Bid’ for selling. You can also directly enter the quantity in the entry box. (Note: make sure to indicate a selling position with a minus (-) sign).
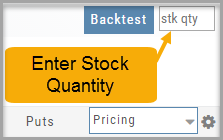
For positions that include the underlying stock, such as Covered Calls, Protective Puts & Collars, enter the stock quantity in the upper right corner of the chain window.
You can change the click quantity amount by changing the default-click parameter (found at the top of the Option Table) for 1x, 5x or 10x.
Start Date
Click the Calendar and select any past Market date. You can quickly choose a previous date by clicking on the “month” then arrow back by year. The closing price for that stock will be displayed.
You are now ready to create the position to analyze – either by clicking “Bid” or “Ask” or by entering the quantity in the appropriate box(es).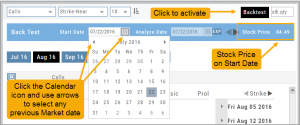
Note: In order to ‘backtest’, the platform needs to establish an orientation point in time. If you change the ‘start date’, the option expiration cycle may change to re-establish the reference point in which to pull information from.
Analyze Date
After the position is entered, click on the “Analyze Date” calendar to select the date.

You can click “EXP” to further analyze the trade on the option’s expiration date or use the arrows to move the original analyze date forward or back.
Your Position Analysis will display with estimated gain/loss calculations and the P/L Graph. 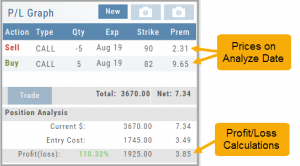
The P/L Graph will also display the stock price on the analyze date via the vertical line.
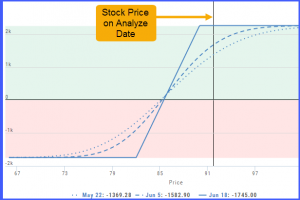 Note: The prices in the options chain will show the start date prices. The prices in the Analysis Panel will reflect the Analyze Date prices.
Once you have selected your date for analysis, you can edit the position, or try a different position, and the analysis will dynamically update.
Backtesting Trade Finder scans
You can ‘look back’ (Backtest) Trade Finder Scans by following these steps:
- Select your Scan (example: Bull Put – Stock above 200 SMA).
- Click on the Calendar at the top of the screen to select a previous date (clicking on the month allows you to select a previous month, or arrow back to a previous year).
- Select stock symbol, click on action icon to ‘Analyze Position’.
- The trade template will populate with the specific scan, note the date on the screen is the ‘start date’
- Select the Analyze Date, or click ‘EXP’ to analyze the position on Expiration Day.
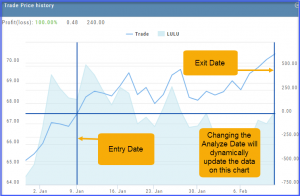
By clicking on the ‘Go Big’ icon of the The Trade Price chart shows the Entry and Exit Dates (cross hairs) as well as the behavior of the trade compared to the stock.
Note: Changing the analyze date dynamically changes the data of the P/L chart.
Use SNAP to Backtest Positions
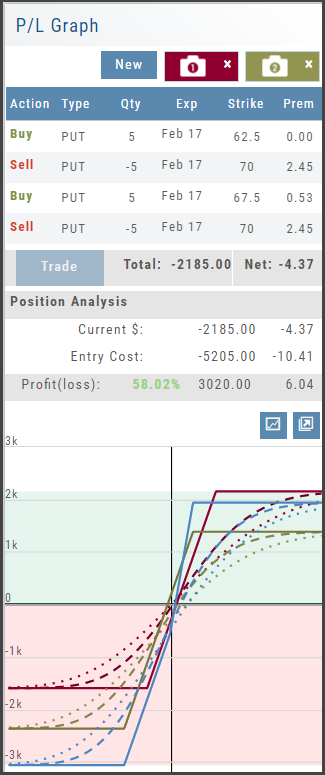
The Snapshot feature is also available with Backtesting.
- Click ‘Backtest’ on the Option Table
- Set up position
- Click one of the camera icons:

- Repeat the first step using the Rolling Icons to adjust the initial position to a new scenario:

- Click the 2nd camera icon & repeat the above steps for the last comparison.
- Select the ‘Analyze Date’ using the Date Picker (Calendar) or “EXP” to analyze the position on Expiration Date.

Trading from the Option Template
From Template to trade is easy. 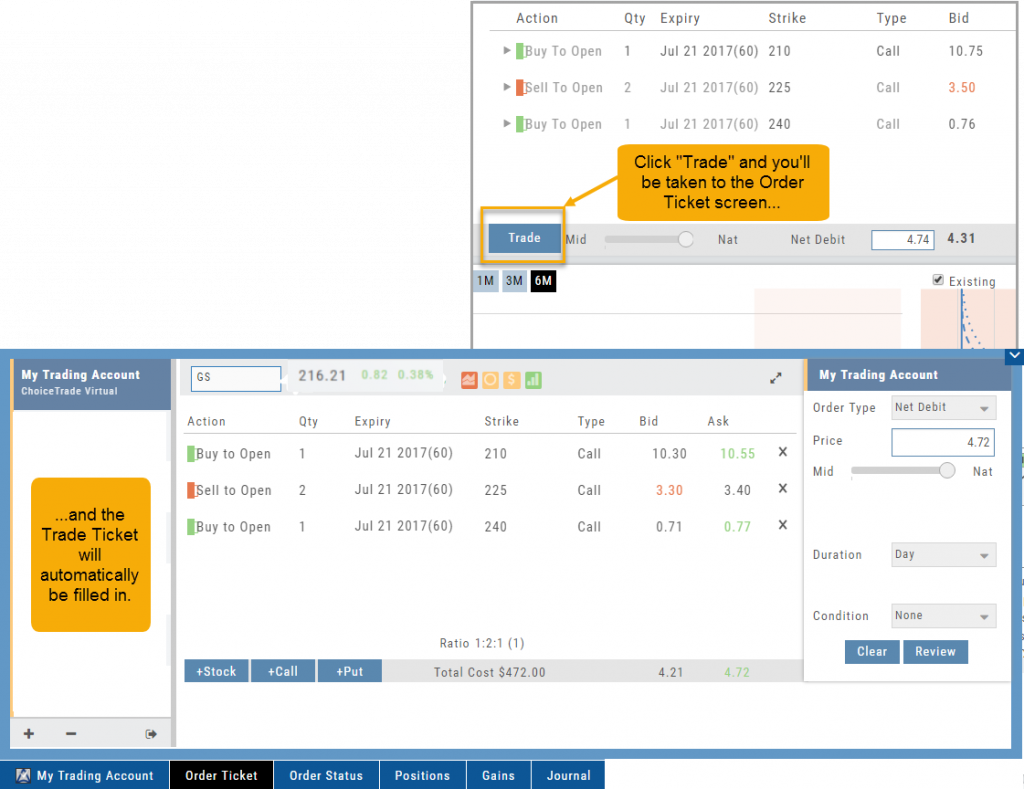
Simply click the “Trade” button on the Option Template and the Order Ticket will be filled in for you. This not only saves time, but eliminates order entry errors.
You can connect directly to select brokerage firms right from the platform and execute the trade.
From Strategize to Analyze to Trade
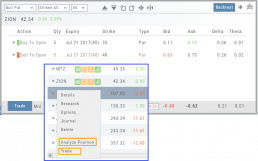
Any strategy-specific options trade will have ‘Analyze’ and ‘Trade’ in the Action Icon.
Click ‘Analyze’ to see the trade in the options chain. From there, you can edit or click ‘Trade’ to have the trade sent to the Order Ticket of your brokerage account.
Give it a try!