Journal - Trade Results
Trade Details
The Journal allows you to view your trade results, including a visual outline of the position from Open to Close, including any Adjustments and Expirations.
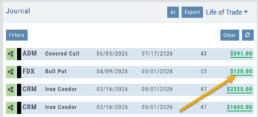
Start in the Life of Trade view.
Click on the Gain/Loss value on the far right of the trade entry
Stock Journal Entry
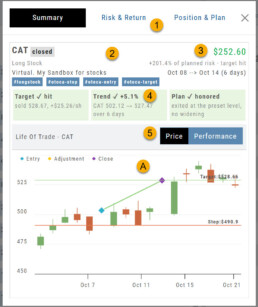
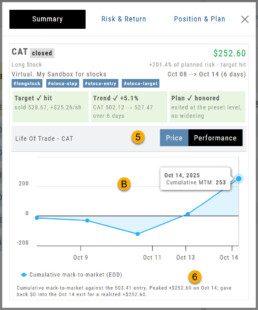
- Overview Tabs: Summary, Risk/Return, Position & Plan
- Trade Summary: Symbol, Trade Status, Position, Account & Tags
- Results: Profit/Loss, % of Target, Duration of Trade
- Evaluation: Color represents a contributing or detracting factor in the trade
- Price/Performance
A. Candlestick chart with position entry/adjustment/close – and OCO Stop/Limit, if applicable.
B. Cumulative activity for trade duration - Summary of Performance
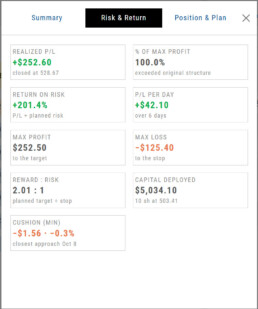
The Risk & Return Tab outlines the trade results.
In this bracket order example:
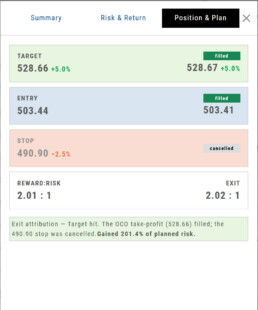
10 shares were purchased at a lower entry price ($503.41) than the order price of $503.44.
6 days later, the Target of $528.66 was reached, and the close order was executed at $528.67
The Stop Order ($490.90) was cancelled automatically.
The original plan outlined a 2.01 Reward:Risk ratio. Due to the lower entry price and higher close price, the result was a slightly higher R/R of 2.02.
The Position and Plan tab offers a breakdown of the trade results.
In this example, the stock trade was executed at a better price and reached it’s target price to close, which was also at a better price. The Stop order was cancelled.
The result shows a slightly better than expected Reward: Risk ratio
Option Journal Entry
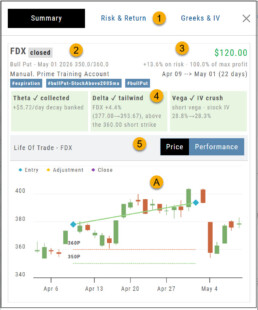
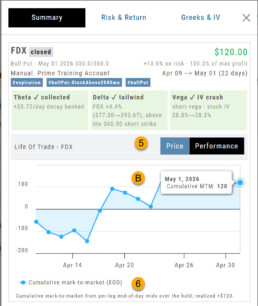
- Overview Tabs: Summary, Risk/Return, Greeks & IV
- Trade Summary: Symbol, Trade Status, Position, Account & Tags
- Results: Profit/Loss, % of Target, Duration of Trade
- Evaluation: Up to 3 Primary Drivers of the Trade
- Price/Performance
A. Candlestick chart with position entry/adjustment/close
B. Cumulative activity for trade duration - Summary of Performance
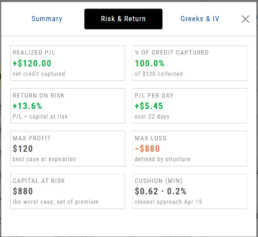
The Risk & Reward Tab summarizes the trade outline and result.
In this example:
The $10 Bull Put Spread resulted in Max Profit of $120 and Max Risk of $880
Duration: 22 days; profit per day: $5.45 ($120/22)
Return on Risk: 13.6% (120/880)
Cushion: How much below the break-even point the trade reached
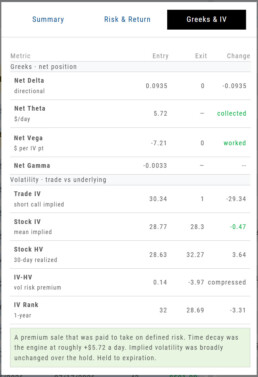
| Metric | What it tells you | Change column shows |
|---|---|---|
| Net Delta | Directional exposure — roughly what the position gains or loses per $1 move in the stock | Signed number |
| Net Theta | $/day — premium the position collects (+) or pays (−) each day it’s held | collected / paid |
| Net Vega | $ per IV point — what the position gains or loses per 1-point change in implied volatility | worked / hurt / faded |
| Net Gamma | How fast Delta itself moves as the stock moves — negative for credit spreads and short premium | Signed number |
| Trade IV | The implied volatility of your own legs — what you actually sold or bought | Signed number |
| Stock IV | The underlying’s mean implied volatility, with HV (30-day historical) shown beneath it | Signed number |
| IV − HV | Volatility risk premium — how far implied sat above (or below) what the stock has actually been doing | Signed number |
| IV Rank | Where implied volatility sat in its own 1-year range, 0–100 | Signed number |
Journal Auto-Reconcile
Journal Auto-Reconcile
The auto-reconciliation in the Trade Journal aligns trades and results—allowing students to focus on analyzing performance instead of managing data. Since consistent review is key to improving as a trader, this streamlines the learning process.
Start in the Reconcile View of the Journal:
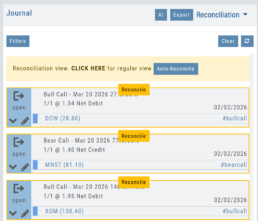
Next, click the  button.
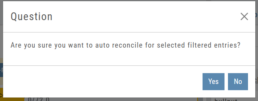
The dialog box to the left will appear:
Click “Yes”
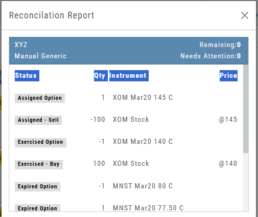
The display will list the resulting action for each expiration.
You can scroll to review.
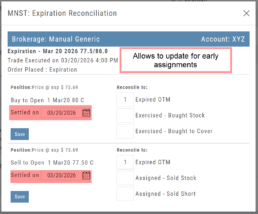
The arrow icon appears on Journal Tabs that can be edited. 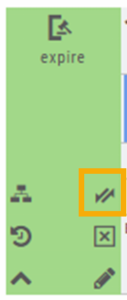
Click on the icon, confirm you want to make changes.
When completed, “Save”
The display will list the resulting action for each expiration.
You can scroll to review.
26-03 Release Notes: Journal Auto-Reconcile, Extended Trading, New Charting Indicators
Platform Release Summary
This release helps you see more of the market, spend less time tracking trades, and apply your strategies with greater confidence—with extended-hours charting, automated journal reconciliation, and new technical indicators.
Journal Auto-Reconcile
The auto-reconciliation in the Trade Journal aligns trades and results—allowing users to focus on analyzing performance instead of managing data. Since consistent review is key to improving as a trader, this feature makes the process significantly easier and more accurate
Start in the Reconcile View of the Journal:
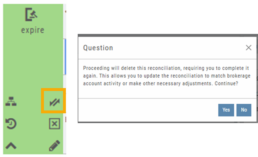
Next, click the button.
The dialog box to the left will appear:
Click “Yes”
The display will list the resulting action for each expiration.
You can scroll to review.
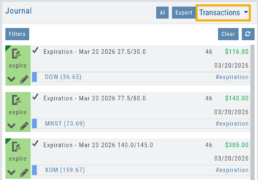
The Reconcile view will clear and all Journal Tabs will update to reflect the action resulting from each Expiration.
The arrow icon (shown) allows editing – including early assignment of options.
Note: This icon will *only* appear on Journal Tabs where the function is permitted.
Example: Stock Positions will not display the icon.
Extended Trading Hours
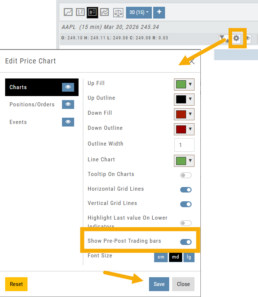
Pre and Post-Market activity can be displayed on Intra-Day charts:
First, click on the Gear icon as shown.
Then, toggle “Show Pre-Post Trading bars” to the On position, as shown.
Finally, “Save“.
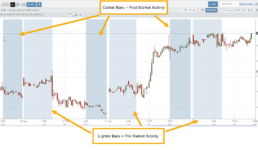
Additions: New Charting Indicators
Chande Momentum Indicator (CMO)
Measures the strength of price movement by evaluating both gains and losses, providing a more balanced view than traditional oscillators.
- Above +50: Indicates overbought conditions (potential selling opportunity)
- Below -50: Indicates oversold conditions (potential buying opportunity)
Summary: Helps identify when price movement may be overextended and due for a reversal.
Chaikin Money Flow (CMF)
An oscillator measuring buying and selling pressure by analyzing money flow volume over a set period, rather than cumulatively.
- Positive values: Indicate buying pressure (accumulation)
- Negative values: Indicate selling pressure (distribution)
- Default setting: 20-period (typically 20 days)
Summary: Helps identify whether money is flowing into or out of a security over a defined timeframe.
Directional Movement Index (DMI)
A trend indicator that measures both the direction and strength of a trend using three lines: ADX, +DI, and -DI.
- +DI above -DI: Indicates an uptrend
- -DI above +DI: Indicates a downtrend
- ADX: Measures trend strength (regardless of direction)
- Default setting: 14-period
Summary: Helps identify trend direction and the trend’s strength
Ultimate Oscillator
A momentum indicator that combines three timeframes to provide a more balanced view of market strength and reduce false signals.
- Higher values: Indicate stronger buying pressure
- Lower values: Indicate stronger selling pressure
- Used to identify overbought/oversold conditions and potential trend reversals
Summary: Helps confirm momentum and spot potential turning points with greater reliability.
Change Log
- Improve OHLC appearance
- Repair drawing annotations on extended chart
- Reconciliation mode functionality fixed
Reconcile Trade Notice
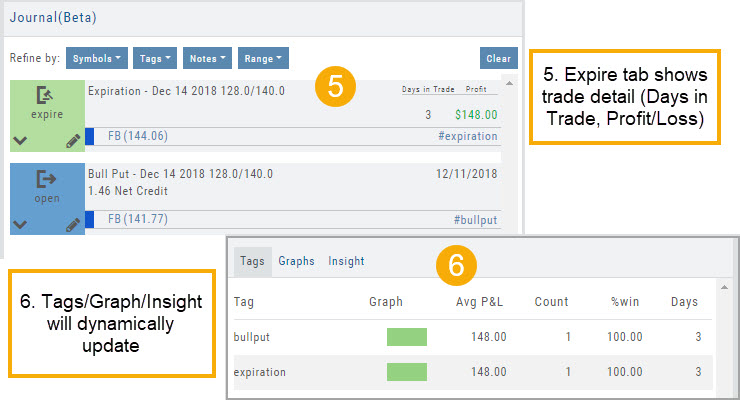
The Tags including the P/L Summary, Graph and new Insight tabs rely on updated Journal entries which includes reconciled trades.
The following notice appears in the Journal when trades needs to be reconciled:

All trades in the trading account(s) selected will display with the option to change back to Regular View:
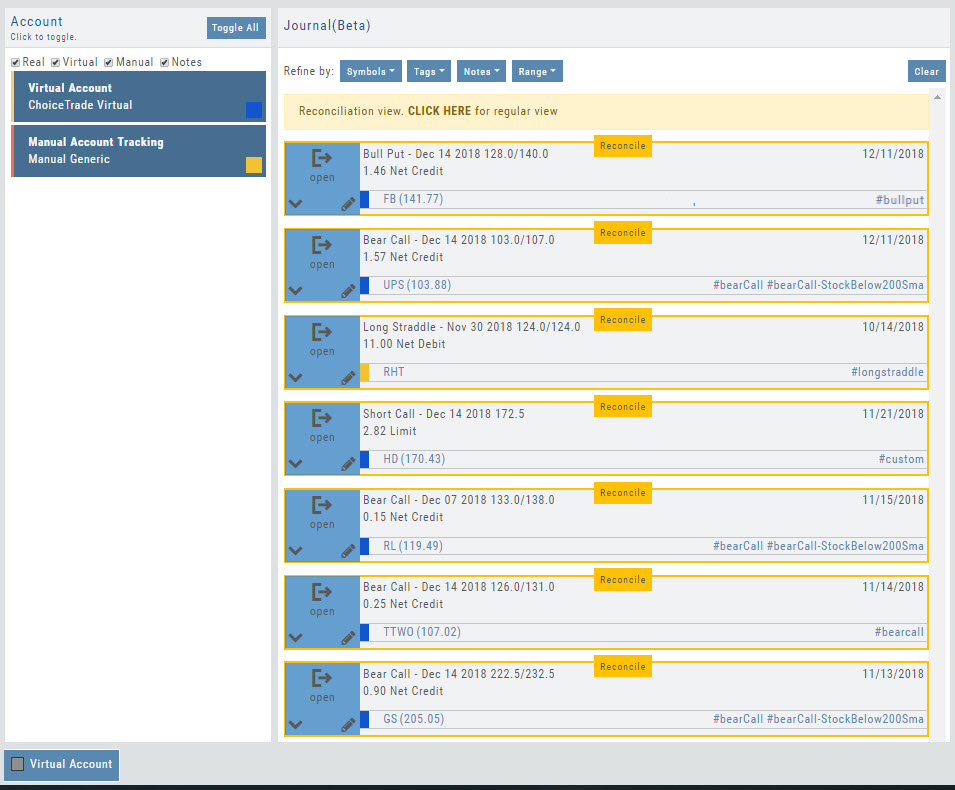
Individual trades are reconciled by clicking on the “Reconcile” tab outlining the Journal Entry.
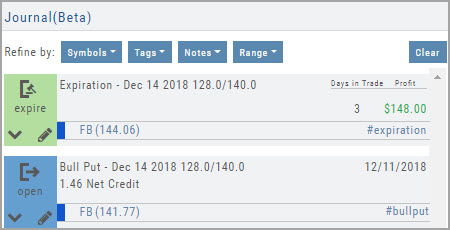
The Journal Tab will update showing the trade had a profit/loss or adjustment in the underlying.
Updating Journal Entries
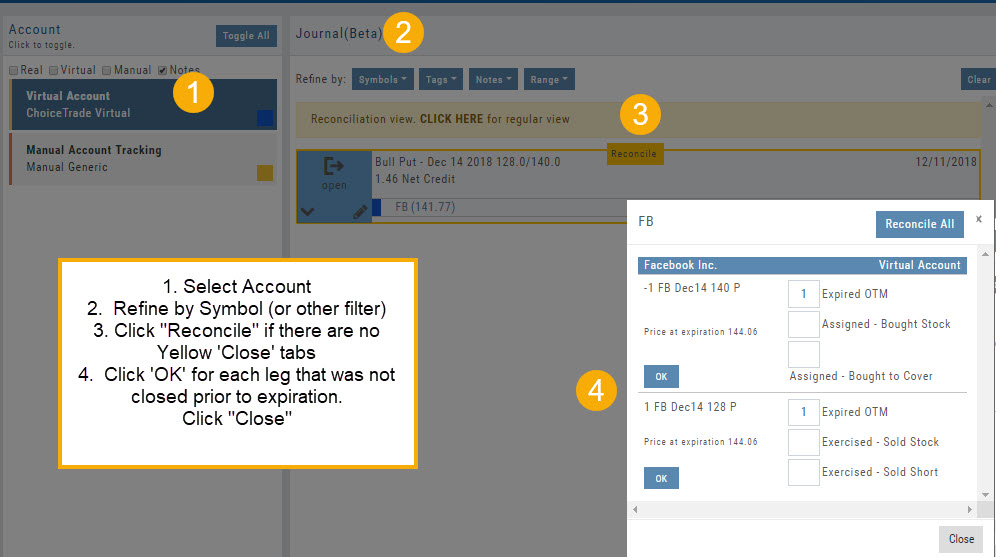
Logging into your account will update Journal entries for up to the last two months. However, trades that expired will need to be Reconciled. If the system is unable to match trades, a Yellow ‘Close’ tab will result, requiring manual action to close.
Follow the steps as shown below to reconcile your trades.
Note: Step 2 is not required, however, if you are just learning to use the Journal and it’s features, sorting by Symbol, especially if you have multiple trades, simplifies the process.