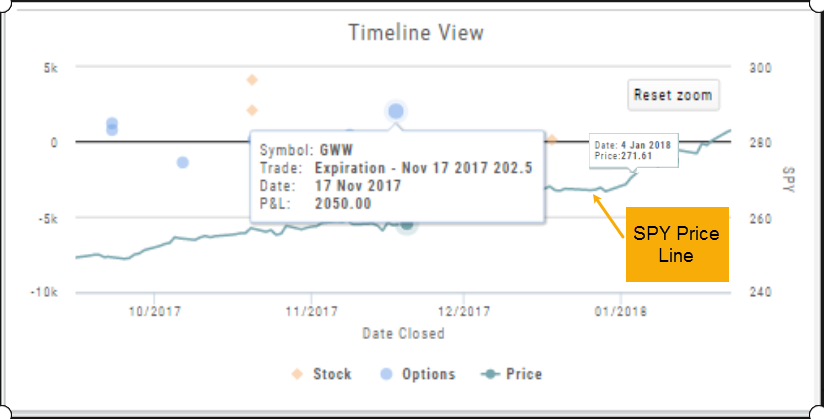
Insight Tab in Journal
The Insight Tab, along with Tags and Graphs update dynamically with the account(s), symbol(s), tag(s) and/or date range selected.
Insight breaks down Overall Performance by Winning and Losing trades in addition to:
- Number of closed trades
- Percent (Winning/Losing Trades)
- Total $ Profit/Loss
- Average Total Profit/Loss
- Biggest (Winning/Losing Trade)
- Average Days in Trade
P/L & Duration/Timeline Graphs
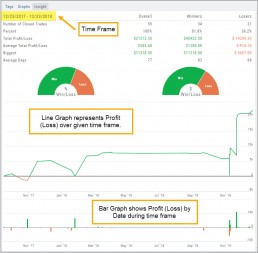
Journal Trade Graphs
This tab offers two views of your Closed, Matched or Reconciled trades: P/L by Trade Duration and P/L by Timeline. The views update dynamically by Account, Symbols, Date Range and #tags.
The Timeline Graph.
Click/Drag your cursor to adjust/enlarge the orientation view.
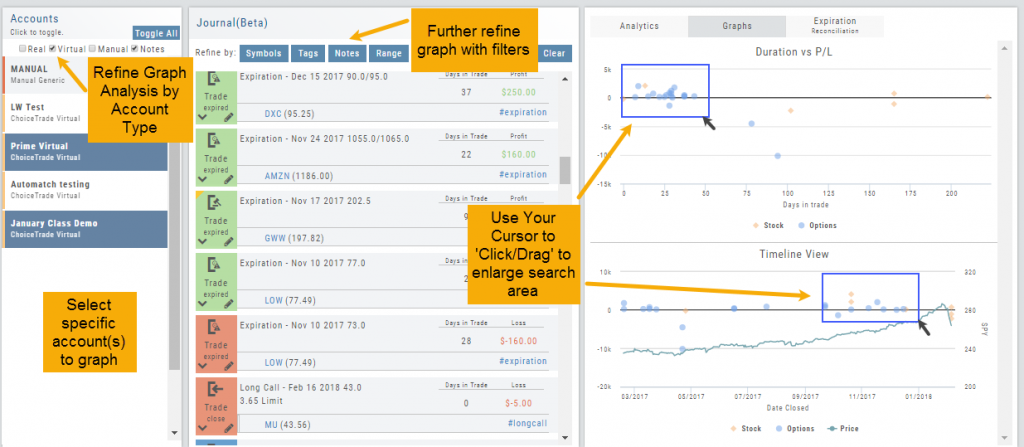
Hover your cursor over each graph plot for trade detail. Circles = Option Trades, Diamonds = Stock Trades. The Duration View shows P/L and # of Days in the Trade
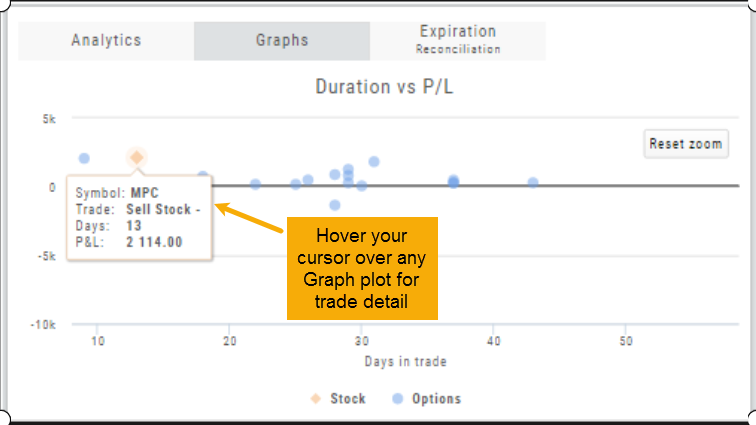
Timeline View displays P/L on Date Closed or Expiration
SPY Price is displayed on the Timeline View. Slide your cursor along this graph line to show end-of-day price for that date.