Almost Real Virtual Accounts
Realistic Trading in a Virtual Environment
Built from the ground up to give you the most realistic experience possible
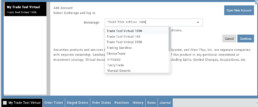
Our new Virtual Accounts are designed to make practice trading more realistic—from the moment an order fills through expiration, assignment, dividends, and margin calculations.
Available starting levels: $10k, 1$00k and $250k
Whether you’re learning the platform, testing a strategy, or practicing before putting real money at risk, your Virtual Account now gives you a much better picture of how trades can actually affect an account.
Better practice.
More realistic outcomes.
More confidence when real money is on the line.
What’s great about these accounts:
Realistic Fills
Fast, market-based fills with potential price improvement—even on spreads.
Accurate Margin & Buying Power
Reg-T margin and buying power are recalculated as your positions and orders change. Margin Interest is calculated at 10% for impact when used.
Option Expiration & Assignment
Options expire, exercise, and assign as they would in a live account—including cash-settled index options.
Dividends
Eligible positions now reflect dividend activity.
Realistic Account Outcomes
Margin calls, reduced buying power, and negative equity can occur when market conditions warrant them.
Journal Tagging - OCO, Trailing Stops, etc.
OCO Journal Tagging
OCO Orders are automatically tagged in the Journal.
Once the Stock Order is Executed (it is an active Position), the Limit and Stop orders are Live (active Orders for the duration selected: Day or GTC.)
If/when the stock hits the Limit price, that order will execute, and the Stop order will be canceled. The Journal tab will be green and display a Gain/Profit.
-OR-
If/when the stock hits the Stop price, that order will execute and the Limit order will be canceled. The Journal tab will be red and display a Loss.
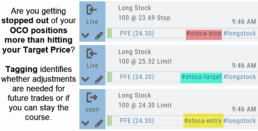
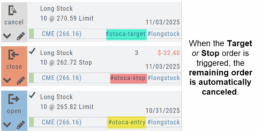
The tagged results show whether you’ve been hitting your target or getting stopped out.
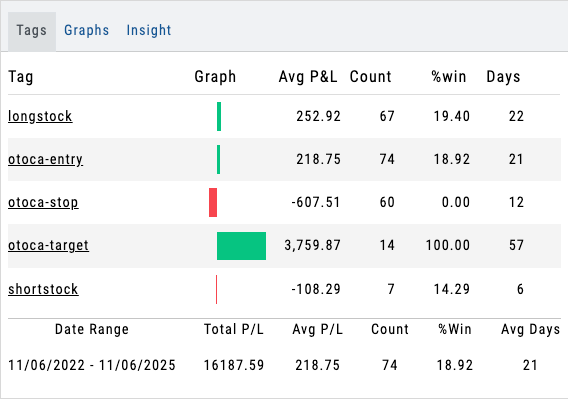
**Note: Past Conditional trades will be tagged as “otoca-entry”, “otoca-target” and “otoca-stop”.
Platform Features Release: Sandbox Trading Account, Order Status Filter & more
Announcing the latest Release of feature and functionality additions and enhancements to the trading platform to assist the investment/trading decision process.
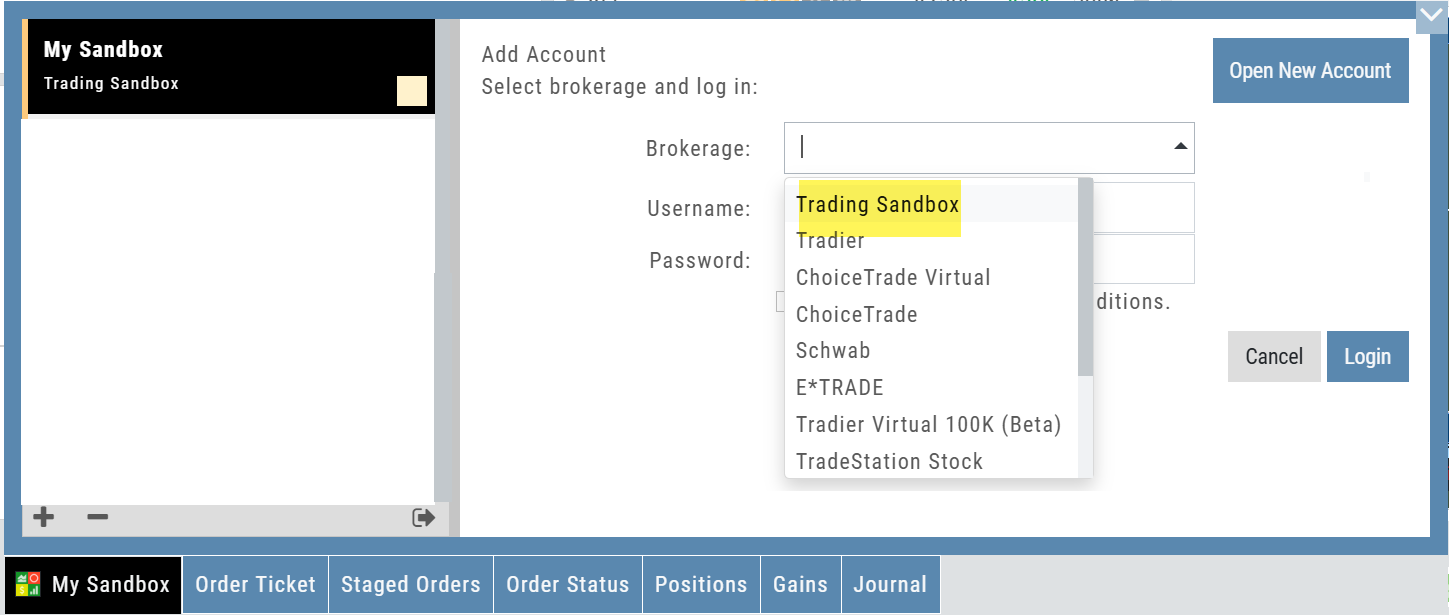
Trading Sandbox Virtual Account
Announcing a new Virtual Account with fast execution, accurate tracking, and reliability you can depend on.
Unlike traditional broker-provided virtual accounts, the Sandbox is not bound by brokerage margin rules or limitations, giving you more freedom to practice and test strategies.
The Sandbox uses delayed market data. In addition to fast, reliable trade execution and accurate trade capture, it also handles options correctly, supports Conditional Orders for stocks, full Journal Support, and more!
Order Status Filter Buttons
The Order Status Tab filter buttons make it easy to locate previous orders

- All – Everything in the time period is shown on the tab (Today, 1 Week, 1 Month, etc.).
- Open- Orders that have not yet executed as an active Trade/Position – includes Waiting Conditional orders.
- Working – Bracket orders where the underlying stock order is an active position (Stop/Limit orders). Excludes Waiting Conditional orders.
- Filled – Executed orders whether to open/modify/close
- Canceled – Includes both manually canceled as well as day orders that did not get filled prior to the end of the Market Day
OCO Journal Tagging
OCO Orders are automatically tagged in the Journal.
Once the Stock Order is Executed (it is an active Position), the Limit and Stop orders are Live (active Orders for the duration selected: Day or GTC.)
If/when the stock hits the Limit price, that order will execute, and the Stop order will be canceled. The Journal tab will be green and display a Gain/Profit.
-OR-
If/when the stock hits the Stop price, that order will execute and the Limit order will be canceled. The Journal tab will be red and display a Loss.
**Note: Past Conditional trades will be tagged as “otoca-entry”, “otoca-target” and “otoca-stop”.
Delayed Streaming Quotes
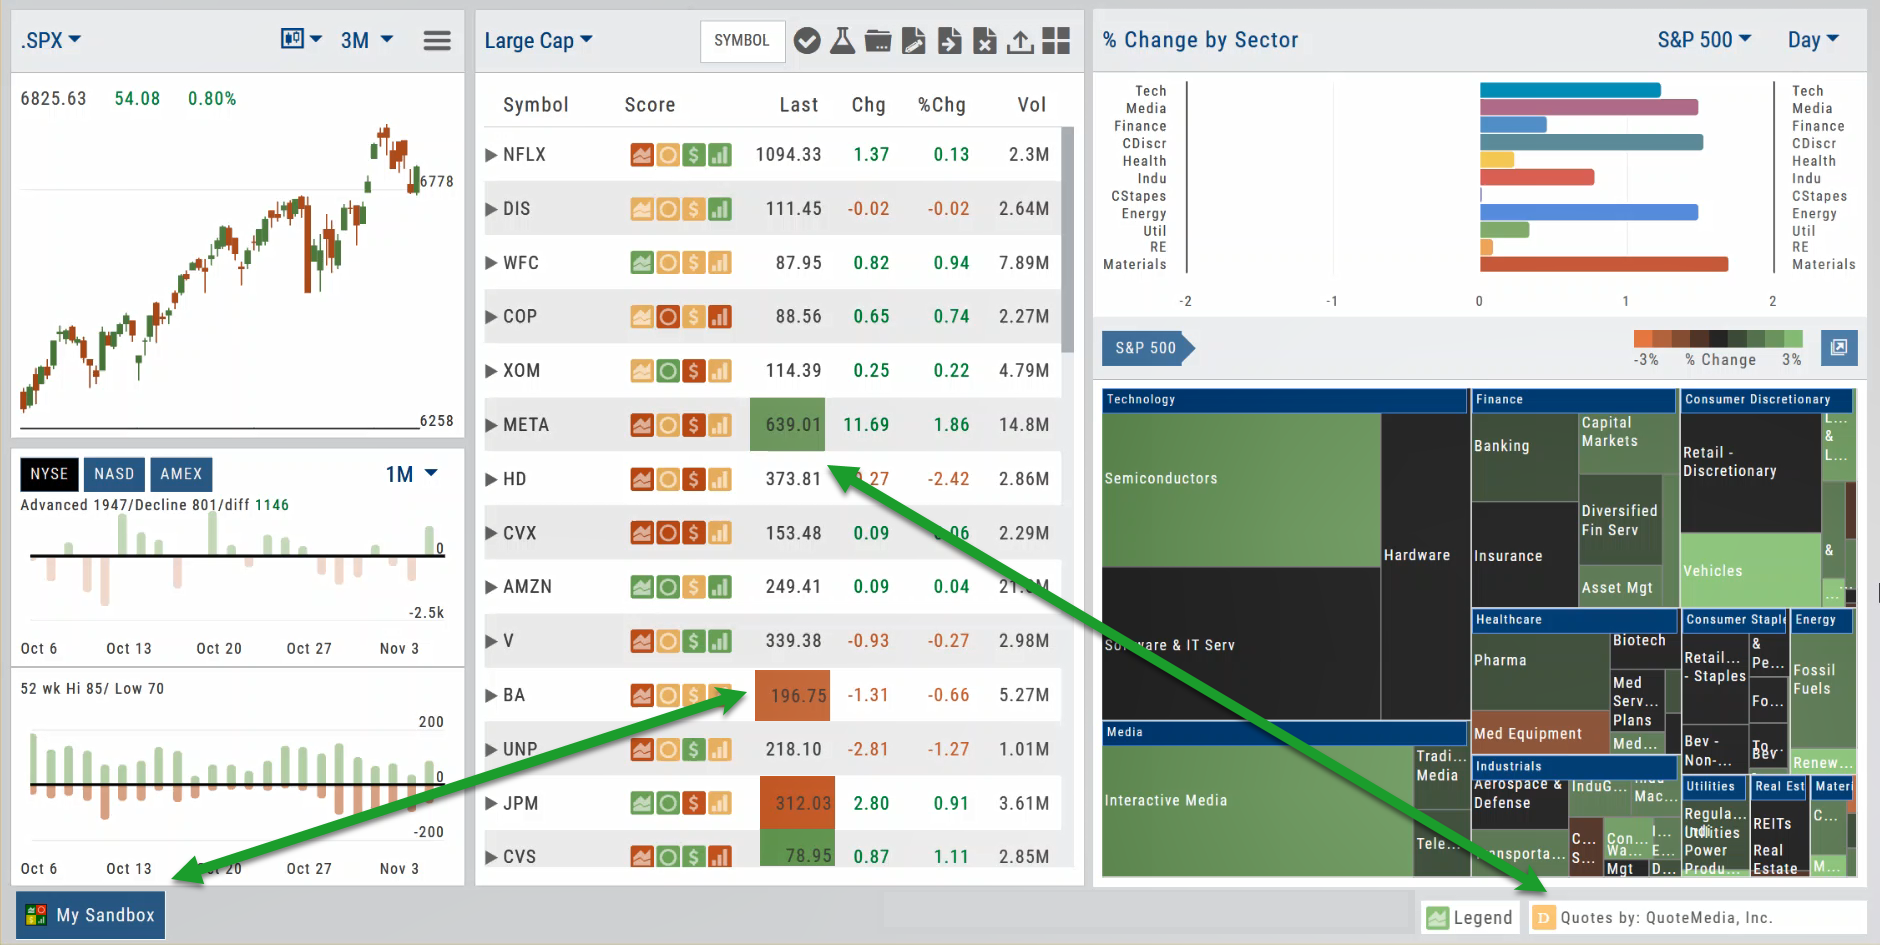
Delayed Streaming Quotes will appear when you have a Virtual or Manual Account activated.
Click on the account tab so that it appears on the bottom left corner of your screen.
Extend Fibonacci Retracements on Charts
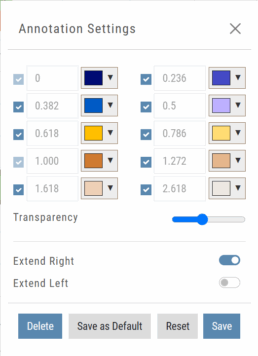
Fibonacci retracements can be extended right and/or left on the chart.
Click an existing Fibonacci annotation, then use the toggle switches to adjust it.
Don’t forget to “Save”
Note: Extend Right/Left can be edited/saved individually, not Set As Default.
Chart crosshairs
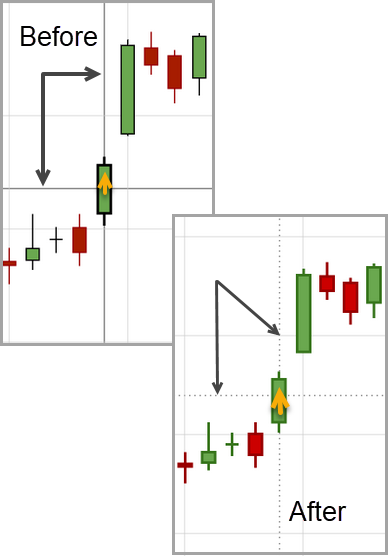
The cursor crosshairs on the chart have been adjusted so they no longer obscure the candlestick wicks
Other Additions
- Set “GTC” as default duration for Exit Order on Trade Ticket
- Modify TTM Squeeze formula to follow industry
- Auto-select Option Cycles for existing Order(s)
Change Log
- Resolved Screener glitch to move candidates to selected watch list
Platform Features Release: New Zoom Functionality, Chart Panning
Announcing the latest Release of feature and functionality additions and enhancements to the trading platform to assist the investment/trading decision process.
New Zoom Functionality
To activate Zoom, click on the Zoom button has been added to the icon toolbar:

- Once activated, the button changes color.
- Click/drag the mouse/cursor over the area of study.
- A “Reset Zoom” button will display when you want to restore the view.
Chart Panning Functionality
Click/drag now pans the time period/price range on the chart – when dragging your mouse/cursor either right/left
Other Additions
- “Choppiness Index” Chart Lower Indictor added
- “Are You Sure You Want To Cancel This Order?” added on Order Status tab
- Clicking on “Quotes By” box (lower right corner) will display source of quotes
Change Log
- Reuse .XSP and .SPX order functionality restored
- Trading Block OTM trade error fixed
- Schwab recognizes BRK.B now
- Resolved Liquidity Range in Screener
Platform Features Release: New Zoom Functionality, Chart Panning
Announcing the latest Release of feature and functionality additions and enhancements to the trading platform to assist the investment/trading decision process.
New Zoom Functionality
To activate Zoom, click on the Zoom button has been added to the icon toolbar:
- Once activated, the button changes color.
- Click/drag the mouse/cursor over the area of study.
- A “Reset Zoom” button will display when you want to restore the view.
Chart Panning Functionality
Click/drag now pans the time period/price range on the chart – when dragging your mouse/cursor either right/left
Other Additions
- “Choppiness Index” Chart Lower Indictor added
- “Are You Sure You Want To Cancel This Order?” added on Order Status tab
- Clicking on “Quotes By” box (lower right corner) will display source of quotes
Change Log
- Reuse .XSP and .SPX order functionality restored
- Trading Block OTM trade error fixed
- Schwab recognizes BRK.B now
- Resolved Liquidity Range in Screener
Platform Features Release: Trade from the Chart, Price Slices, Reset Virtual Account Options
Announcing the latest Release of feature and functionality enhancements to the trading platform to improve the position evaluation process, trade submitting process as well as offer additional practice account settings:
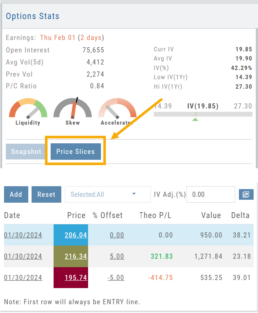
Price Slices: Evaluate theoretical outcomes of option positions when using the Strategy Templates.
Trade from the Chart: Use the control box or lines on Chart to adjust the entry point, Target Price and/or Stop Price.
Reset Virtual Account – Add ‘funds’ to an existing account OR reset everything and start fresh. You decide.
Price Slices (Premium Feature)
The  Button appears on the right side of the screen when using the Strategy Templates.
Select one of the 22 Option Strategy Templates.
Build the position.
Click the Price Slices button to start your evaluation
Change the Date (default ‘today’), Price levels and/or % Offset
Add IV to view how this affects the theoretical P/L
Click the Go Big icon to view additional Greek data
Trade from the Chart
The  button appears at the top of the chart for any symbol – whether there is an existing position or not.
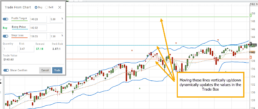
Clicking this button activates an Order Window on the Chart, like this:
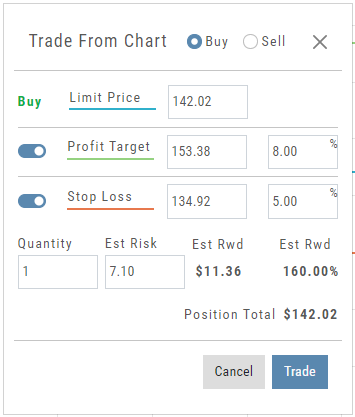
Note: Buy, Profit and Stop Loss line colors will match those displayed on the chart itself.
The values in the Order Window can be manually adjusted by $ or %
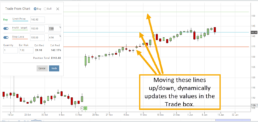
The values can also be dynamically adjusted by moving the corresponding line(s) on the Chart itself.
The Quantity value default is “1” to show the ‘per share’ dollar and percentage estimated risk, reward, as well as Position Total.
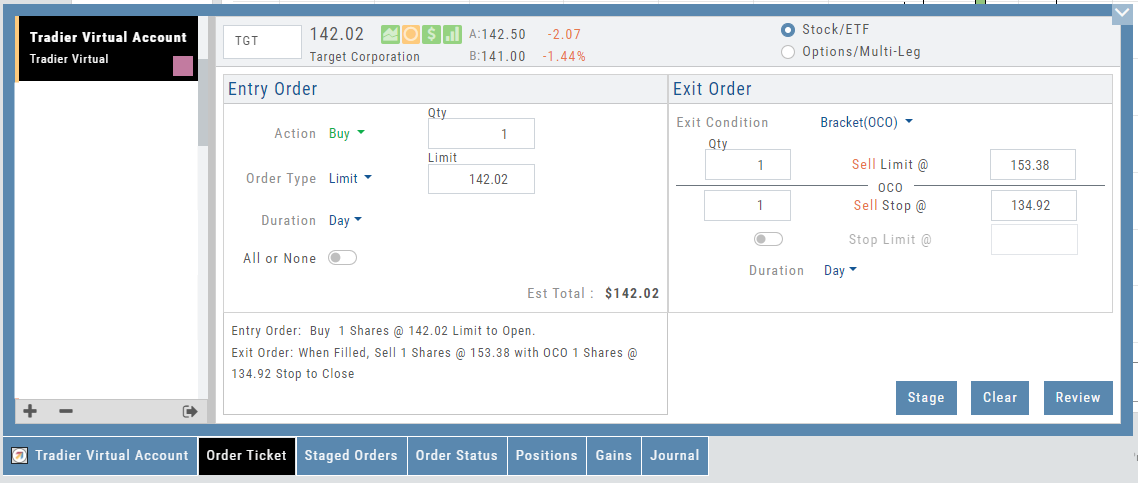
Click “Trade” for the prefilled Order Ticket to display.
The Order Ticket can be further adjusted, Staged or Reviewed to ensure it’s completed to your satisfaction, then Submitted.
Note: The brokerage selected must support Bracket Orders if the Stop/Stop Limit values are selected on the Order Window
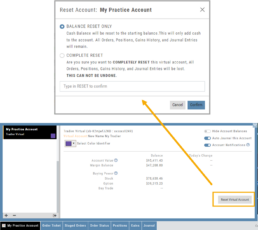
Reset Tradier Virtual Account – 2 options
Tradier’s Virtual Account gives you the ability to add more “Cash” to your practice account – OR – completely start over:
On the account summary page, click “Reset Virtual Account”
Select “Balance Reset Only” – to keep your existing trade activity, but add more “cash” to your virtual account.
Select “Complete Reset” – if you want to remove all prior transactions, including Journal Entries, Gains, Orders, Positions, etc. Note: This selection cannot be undone once it’s processed.
Type RESET in the box provided, then click the “Confirm” button
Enhancements
- ATM Option Strikes are bolded for easier identification
Change Log
- Adjusted theme contrast
- Corrected Order Type Limit price entry
- Snapshot functionality restored
Trade from the Chart
Trade from the Chart
The button appears at the top of the chart for any symbol – whether there is an existing position or not.
Clicking this button activates an Order Window on the Chart, like this:
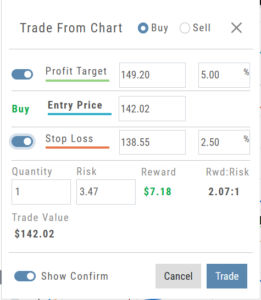
Note: Buy, Profit and Stop Loss line colors will match those displayed on the chart itself.
The values in the Order Window can be manually adjusted by $ or %
The values can also be dynamically adjusted by moving the corresponding line(s) on the Chart itself.
The Quantity value default is “1” to show the ‘per share’ dollar and percentage estimated risk, reward, as well as Position Total.
Show Order Status (Go to Order Ticket)
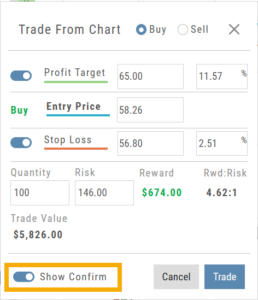
When trading from the Chart (OCO orders), you can elect to Show Confirmation – or not.
Toggling “On” will take you to the Order Ticket to review and submit your Order to the supporting brokerage.
Additional edits and staging the order are enabled with this selection.
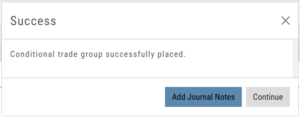
Once reviewed and submitted, you’ll get a confirmation that the order was submitted, as shown here:
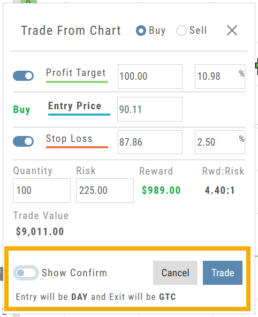
Toggling “Show Confirm” to Off, will bypass the Order Ticket window and convert the “Trade from the Charts” action to an Order Ticket itself.
Notice: The Entry is a Day Order, the Exit is a GTC order
Clicking “Submit” will send the order directly to the supporting brokerage.
Since the “Order Ticket” is bypassed, this order cannot be further edited or Staged.
Once submitted, as with “Show Confirm” activated, you’ll see this notice:
Position Notifications
When you Enable and Activate Account Notifications, you’ll receive emails on upcoming activity that may affect your existing positions.
- Upcoming Earnings – Monday Morning via Email
- Upcoming Dividends – Monday Morning via Email
- Option Position Expiring – Two days prior via Email
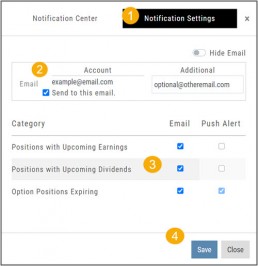
To begin, locate and click on the Envelope Icon at the top of the platform page, next to your Username:

Follow the steps as outlined and illustrated:
- Click on Notification Settings
- Add your email (Optional: Add 2nd email)
- Check/uncheck Categories
- Click “Save”
The settings can be updated at anytime by following the above steps.
Next:
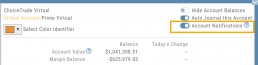
For each account you want to receive notifications on, toggle the switch located on the Account Summary tab to the “On” position as shown in the graphic.
**Without this step, you won’t receive the notifications.**
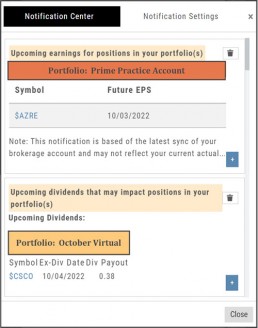
Expiration Notifications will be emailed 2 days in advance.
Each Monday, prior to Market Open, an email will be sent where there’s an Earnings or Dividend for any of the positions in the account(s) you have activated.
The Notification Center will list what has been emailed to you for each account you have activated.
The Account Name and associated Color Tag will be displayed on each Notification and allows for quick identification.
Platform Feature Release: Screener
Feature Release Notes: Screener
Announcing the latest feature/function updates, additions or edits to the trading platform:
Screener – Trading styles are unique. Screener, the platform’s newest feature allows for customized opportunity searches. Differing from Scans, which are predefined, Screener offers over 120 data points for customize searches based on what the user’s goals are. Additional data points will be forthcoming.
Screener searches may be saved and named for the user’s future use. In addition, System Screeners are available as starting point templates for the user to customize and save as personal Screeners.
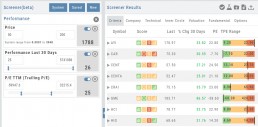
Screener
Located under the Find Tab, the Advanced Screener is designed to allow the user to customize their own trade candidate searches. Over 125 criteria selections are available – with more to follow.
Screener is flexible – allowing you to create save as many Screen searches as you wish, edit as needed, even download results.
Screens are user-defined, 100% customized by the user’s specifications. They can be edited, saved and deleted.
Left Control Panel

New – Create a new screener
Saved – Previously created and saved screens. Saved screens can be edited for a single-use or saved as a new screen or overwriting the previously saved screen
System – Templates available for use as starting points for new screeners. While the System screens themselves cannot be modified, they can be used as a foundation for newly created screens that – can be modified for personal use and saved.
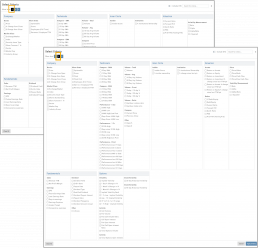
Select your Criteria
There are 3 Levels of Data. Currently Level 3 mirrors Level 2 – as more criteria will be added to this feature.
Level 1 offers Basic Information to select from. Level 2 expands upon what Level 1 offers.
After choosing your criteria, you’ll be able to set the parameters for each criteria selection on the next screen.
Click “Run Search”
Note: The order the criteria is selected, will be the order the selections are displayed on the next screen.
The Results
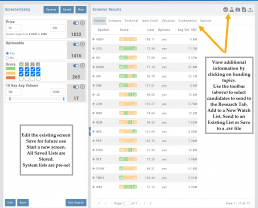
The criteria selected in this example were Price ($50-200), Optionable, Score (Green or Yellow for each Icon) and 10-day Average Volume (5M-293M) resulting in 17 candidates.
From here, using the Icon Toolbar, candidates can be selected and:
- Sent to Research for further analysis
- Sent to an existing Watch List
- Used to create a New list
- Can be download to a .csv file.
The Screen itself can be Saved (and named), further modified -either by
adjusting the existing criteria or adding new datapoints – or a New Screen
can be created.
Additional data is accessible by clicking on “Company”, “Technical”, etc
above the list of candidates.
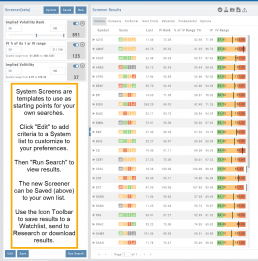
System Screens are also available and new ones will be added.
The user can customize such screens and save to the platform just as any other
screen.
Candidates can be sent to Research, to a Watch List and/or
downloaded to a .csv file.
System Screens themselves cannot be modified and are designed to be
‘launching points’ for the user’s convenience if they wish to use them.
Note the colored bar graph of IV Range. It provides a ‘picture’ of where this
Stock/ETF is now for this datapoint.
Change Log
- TTM Squeeze Indicator added
- Option Chain column line up
- Double scroll bars appearing in Safari/Screener
- Split notification on Chart added
- Staged Order behavior -data loading resolved
- Trade Button appearance on Chart from Staged
- Industry Link responsive
- Mobile – corrected Stage Button function on Stock Order Ticket
- Mobile – updated “Save” Alert functionality
- Mobile – adding Indicator (Android) corrected
- Earnings < 7 days are noted in red
Screener (Premium Desktop Feature)
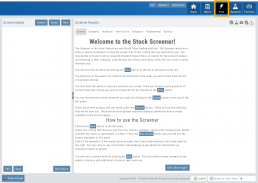
Screener
Located under the Find Tab, the Advanced Screener is designed to allow the user to customize their own trade candidate searches. Several hundred data points are available to select from, build your Screen, Save for future use and Edit as needed.
Screener is flexible – allowing you to create save as many Screen searches as you wish, edit as needed, even download results.
Screens are user-defined, and 100% customized to the user’s specifications. They can be edited, saved, and deleted.
Left Control Panel
New – Create a new screener
Saved – Previously created and saved screens. Saved screens can be edited for single use, saved as a new screen, or to overwrite the previously saved screen
System – Templates available for use as starting points for new screeners. While the System screens themselves cannot be modified, they can be used as a foundation for newly created screens that can be modified for personal use and saved.
Select your criteria
There are 3 Levels of Data.
Level 1 offers Basic Information to select from. Level 2 expands upon what Level 1 offers. Level 3 offers all available, in-depth selections.
After choosing your criteria, you’ll be able to set the parameters for each criteria selection on the next screen.
Click “Run Search”
Note: The order the criteria are selected, will be the order the selections are displayed on the next screen.
The Results
The criteria selected in this example were Price ($50-200), Optionable, Score (Green or Yellow for each Icon), and 10-day Average Volume (5M-293M) resulting in 17 candidates.
From here, using the Icon Toolbar, candidates can be selected and:
- Sent to Research for further analysis
- Sent to an existing Watch List
- Used to create a New list
- Can be downloaded to a .csv file.
The Screen itself can be Saved (and named), or further modified – either by
adjusting the existing criteria or adding new data points – or a New Screen
can be created.
Additional data is accessible by clicking on “Company”, “Technical”, etc
above the list of candidates.
Icon Tool Bar – Hover Cursor over Icon to view function
Select one or more symbols
Send selections to Research
Create a New Watchlist with Selected Candidates
Send Candidate to an Existing Watchlist
Download to .csv file
System Screens are also available and new ones will be added.
The user can customize such screens and save to the platform just as any other
screen.
Candidates can be sent to Research, to a Watch List and/or
downloaded to a .csv file.
System Screens themselves cannot be modified and are designed to be
‘launching points’ for the user’s convenience if they wish to use them.
Note the colored bar graph of IV Range. It provides a ‘picture’ of where this
Stock/ETF is now for this datapoint.
Edit Screeners
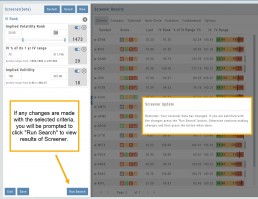
Edit current, Saved or System Screeners by adjusting parameters of existing criteria using the slide bars, entering values in boxes, etc.
A Screener Update notice will appear prompting you to select “Run Search” after adjustments are completed. Updated results will populate the left table.
From here, use the Icon Toolbar for further options: Select, Add to Watchlist, Research or Download.
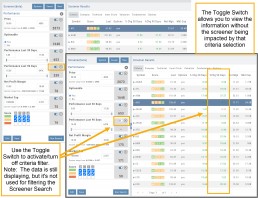
Toggle Criteria
The Toggle feature gives you additional flexibility in your Screener searches.
The ON position includes the selected criteria in calculating results.
The OFF position for that criteria will not affect the results when used to filter results. However, that data column will still be displayed with the other points selected.